
Black Rock City Life – Event Visualizer
Last night I was thinking about how placement tries to place camps with the goal of creating balanced neighborhoods where there’s always something going on. I do remember as I hiked around black rock city having a sense that certain neighborhoods and time periods were much more active than others. Sometimes my whole block was fully dead; other times I walked down certain blocks and it seemed like every camp was fully lit up with activity.
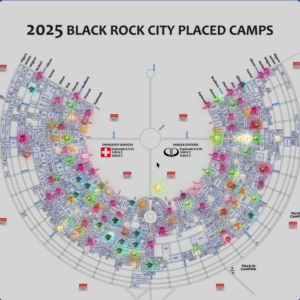
I realized that with the data in the API it should be super easy just to make a visualizer that shows all scheduled events on a map with a slider that lets you set the time and see the events happening at that time, lit up. So I made one!
Features
- Interactive Map: View the Black Rock City 2025 map with event locations
- Zoom & Pan: Use mouse wheel to zoom in/out, click and drag to pan around the map, double-click to reset view
- Time Slider: Scrub through the entire week of Burning Man (August 24 – September 1, 2025)
- Event Visualization: See events as emoji markers on the map based on their type:
- 🎵 Pink: Music/Party
- 🎓 Cyan: Class/Workshop
- 🍕 Yellow: Food
- 🍹 Green: Beverages
- 🎨 Orange: Arts & Crafts
- 🔞 Red: Mature Audiences
- ✨ White: Other
- Playback Controls: Play/pause the timeline, adjust speed (1x, 2x, 5x, 10x), default speed is 10x
- Event Details: Hover over any event marker to see details in the status bar at the bottom
- Day/Night Cycle: Visual darkening of the map during nighttime hours (with sunrise/sunset transitions)
- Long Event Filter: Toggle to hide/show events that are 6+ hours long
- Live Event Count: See how many events are happening at any given time
- Pacific Time Display: All times shown in Pacific Time (America/Los_Angeles)
Website URL: https://brclife.vercel.app/
GitHub URL: https://github.com/jspolsky/brclife/